Pour les problèmes les plus difficiles – le raisonnement visuel abstrait comme ARC-AGI-2, les mathématiques de niveau recherche comme FrontierMath, ou les questions multidisciplinaires de niveau expert comme Humanity's Last Exam – le classement public constitue un guide raisonnable : choisissez le modèle le mieux classé et vous obtiendrez probablement le meilleur résultat.
Pour les problèmes simples, comme la classification de texte ou l'extraction d'entités, l'ajustement fin (fine-tuning) d'un petit modèle sur quelques milliers d'exemples étiquetés suffit souvent, pour une fraction du coût.
L'écart intéressant se situe au milieu : des tâches réellement complexes, qui exigent de véritables connaissances métier et du jugement – mais qui ne sont pas si difficiles que seuls les modèles de pointe peuvent les gérer. En pratique, faire tourner un modèle de pointe sur chaque requête à grande échelle n'est pas viable. Mais il n'est pas évident de savoir si des modèles plus petits et moins coûteux tiennent la route sur ce type de tâches.
Cet article explore la manière dont nous avons abordé cette question chez Red Sift – ce que nous avons mesuré, comment nous l'avons mesuré, et ce que les résultats nous apprennent sur le choix des modèles pour ce type de tâche.
La tâche : synthétiser des évaluations de sécurité
Radar Lite exécute des vérifications de sécurité automatisées sur des domaines dans trois domaines : la sécurité des e-mails, l'intégrité DNS et la configuration web/TLS. Le résultat brut est un enregistrement structuré de résultats de tests – réussite, échec, avertissement, neutre – avec des preuves et des remarques pour chaque constat.
Le rôle de l'outil de synthèse est de traduire cela en un rapport markdown lisible : faire ressortir les échecs les plus importants, expliquer leur impact réel, et fournir des recommandations concrètes.
Il s'agit d'une tâche d'évaluation idéale pour plusieurs raisons :
- Elle exige de véritables connaissances métier. DMARC, SPF, DKIM, MTA-STS, DNSSEC, chaînes de certificats TLS – ce ne sont pas des sujets qui apparaissent massivement dans les données d'entraînement génériques. Un modèle qui considère DMARC p=none comme un résultat positif, ou qui confond une chaîne DNSSEC rompue avec un simple avertissement mineur plutôt qu'un risque de panne, produira des synthèses qui induiront activement les équipes de sécurité en erreur.
- C'est difficile, mais pas extrêmement difficile. Les preuves sont fournies – le modèle n'a pas besoin de découvrir quoi que ce soit, seulement de les interpréter correctement et d'écrire clairement. Le plafond, c'est une rédaction structurée et ancrée dans le domaine, pas un raisonnement ouvert ou une preuve mathématique.
- La qualité est mesurable. Précision, exhaustivité, structure, clarté – ce sont des dimensions concrètes et évaluables, ce qui permet une notation cohérente.
- Les enjeux de coût et de latence sont réels. Radar Lite est un outil gratuit. Faire tourner des modèles de pointe sur chaque requête n'est pas viable à grande échelle, donc le compromis coût-qualité a des conséquences directes en production.
Construction du benchmark
Avant d'exécuter toute vérification de sécurité, Radar Lite analyse la requête en langage naturel de l'utilisateur pour détecter deux éléments :
- L'intention – le domaine de sécurité concerné par la question de l'utilisateur : EMAIL (DMARC, SPF, DKIM, MTA-STS), DNS (DNSSEC, enregistrements CAA), WEB (configuration TLS, HTTPS, HSTS), ou ANY pour une évaluation complète sur les trois
- La portée – combien de domaines sont concernés et comment : SINGLE pour un seul domaine, MULTI pour plusieurs domaines évalués indépendamment, ou COMPARE pour une comparaison côte à côte
Les deux déterminent quelles vérifications sont exécutées et, surtout, ce que l'on attend de l'outil de synthèse – une synthèse COMPARE doit établir des contrastes et désigner un gagnant ; une synthèse MULTI doit comporter une section distincte par domaine. C'est ce qui rend l'échantillonnage du benchmark non trivial : la nature de la tâche change selon ce que l'utilisateur a demandé.
Nous avons extrait environ 3 000 requêtes de production réelles depuis le stockage, puis les avons réduites à un jeu de données de benchmark de 100 entrées. Un échantillonnage aléatoire aurait favorisé le type de requête le plus courant – un seul domaine, intention « any » – nous avons donc utilisé un échantillonnage stratifié pour garantir que l'ensemble du comportement de l'outil de synthèse soit couvert :
Répartition de l'échantillonnage du benchmark
Dimension | Distribution |
Portée | SINGLE 60 %, MULTI 20 %, COMPARE 20 % |
Intention | ANY 40 %, WEB 20 %, EMAIL 20 %, DNS 20 % |
Le jeu de données présente quatre propriétés clés :
- Représentatif – la répartition des portées reflète les proportions de production tout en sur-échantillonnant délibérément MULTI et COMPARE, qui sont structurellement plus difficiles et plus susceptibles de révéler les faiblesses des modèles
- Diversifié – la répartition des intentions garantit que les trois domaines de sécurité sont couverts, plutôt que de se limiter au type de requête le plus courant
- Non biaisé – la contrainte d'unicité des domaines signifie que chaque entrée constitue une observation véritablement indépendante ; l'infrastructure d'aucune organisation n'influence de manière disproportionnée les résultats
- Statistiquement significatif – avec 100 entrées, des écarts de score d'environ 3 à 5 points sont détectables de manière fiable sur l'échelle normalisée de 0 à 1, ce qui permet de distinguer les véritables différences entre modèles du bruit statistique
Évaluer la qualité : LLM en tant que juge
Les métriques automatiques standards comme BLEU ou ROUGE ne fonctionnent pas ici. Une bonne synthèse n'est pas celle qui correspond à une chaîne de référence – c'est celle qui est précise, bien structurée et exploitable. Nous avons utilisé une approche de type LLM-juge, mais plusieurs variantes sont à considérer.
- La comparaison par paires – demander à un modèle juge de choisir le meilleur de deux résultats – est populaire, mais avec un grand nombre de configurations de modèles et 100 entrées chacune, il faudrait des milliers de comparaisons rien que pour les classer. Et même dans ce cas, on saurait quel modèle a gagné sans savoir pourquoi.
- La notation directe évite le problème de mise à l'échelle, mais le juge invente en pratique son propre barème à chaque fois, ce qui produit des résultats incohérents d'une exécution à l'autre.
- Un barème structuré résout les deux problèmes : les critères sont fixés à l'avance, donc le juge n'a aucune marge de dérive, et les scores par critère montrent exactement où chaque modèle est en défaut. Nous avons utilisé une notation de 0 à 2 plutôt que binaire, car certains critères ont un véritable état intermédiaire – partiellement correct est significativement différent de juste ou faux.
Nous avons abouti à un barème de 13 critères ancré dans les exigences de sortie de Radar Lite :
- Exactitude factuelle – aucun problème inventé, tous les échecs signalés
- Langue et ton – aucun jargon interne divulgué, mise en forme correcte, registre professionnel
- Gravité et structure – utilisation correcte des emojis, niveaux de titres, regroupement des problèmes
- Profondeur – précision de la cause racine, recommandations exploitables
- Exactitude métier – règles de suppression MX-null (par exemple, ne pas signaler l'absence de MTA-STS sur un domaine sans messagerie), mise en forme spécifique à la portée pour les requêtes multi-domaines
Chaque critère est noté de 0 à 2, pour un maximum de 26 points bruts, normalisés sur une échelle de 0 à 1.
Avant d'utiliser le juge à grande échelle, nous l'avons validé. Trois modèles juges candidats ont chacun été exécutés 5 fois de manière indépendante sur les mêmes entrées, et nous avons mesuré la cohérence par critère – à quelle fréquence le même modèle attribuait le même score pour la même entrée à travers des exécutions indépendantes. GPT-5.4 avec un effort de raisonnement faible est arrivé en tête : 11 critères sur 13 ont produit des scores identiques sur les 5 exécutions, et les moyennes par critère sur l'ensemble des exécutions allaient de 0,81 à 0,88 – un écart étroit qui indique un calibrage stable. Il a été retenu comme juge pour l'exécution complète du benchmark.
Les modèles
Nous avons évalué des modèles provenant à la fois de fournisseurs commerciaux et de versions open source :
- OpenAI : GPT-5, GPT-5 mini, GPT-5 nano
- Anthropic : Claude Sonnet 4.6, Claude Haiku 4.5
- Google : Gemini 3.1 Pro, Gemini 3 Flash, Gemini 3.1 Flash Lite, Gemma 4 26B (via Vertex AI)
- Auto-hébergés en open source : Qwen3.5 122B, Qwen3.6 35B, Gemma 4 26B
Gemma 4 apparaît dans les deux listes – il a été exécuté sur notre propre infrastructure et via Vertex AI, afin de vérifier que notre configuration produit des résultats comparables à ceux du fournisseur géré. Plusieurs modèles ont été testés avec et sans raisonnement étendu, afin de comprendre si la latence et le coût en tokens supplémentaires produisent des synthèses significativement meilleures.
Ce que nous avons découvert
Nous avons exécuté chaque configuration sur l'ensemble du jeu de données de 100 entrées, avec GPT-5 comme juge. Voici les résultats obtenus.
Les modèles de pointe mènent la course – mais pas autant que prévu
Gemini 3.1 Pro et Claude Sonnet 4.6 se placent en tête avec 0,93 et 0,92. Mais ils ne jouent pas dans une catégorie différente des modèles suivants. Plusieurs modèles intermédiaires – la plupart avec une forme de raisonnement activée – se regroupent entre 0,88 et 0,90, tous à moins de 0,05 du meilleur résultat : GPT-5 en raisonnement faible, Gemma 4 26B en raisonnement étendu et Gemini 3 Flash en raisonnement faible.
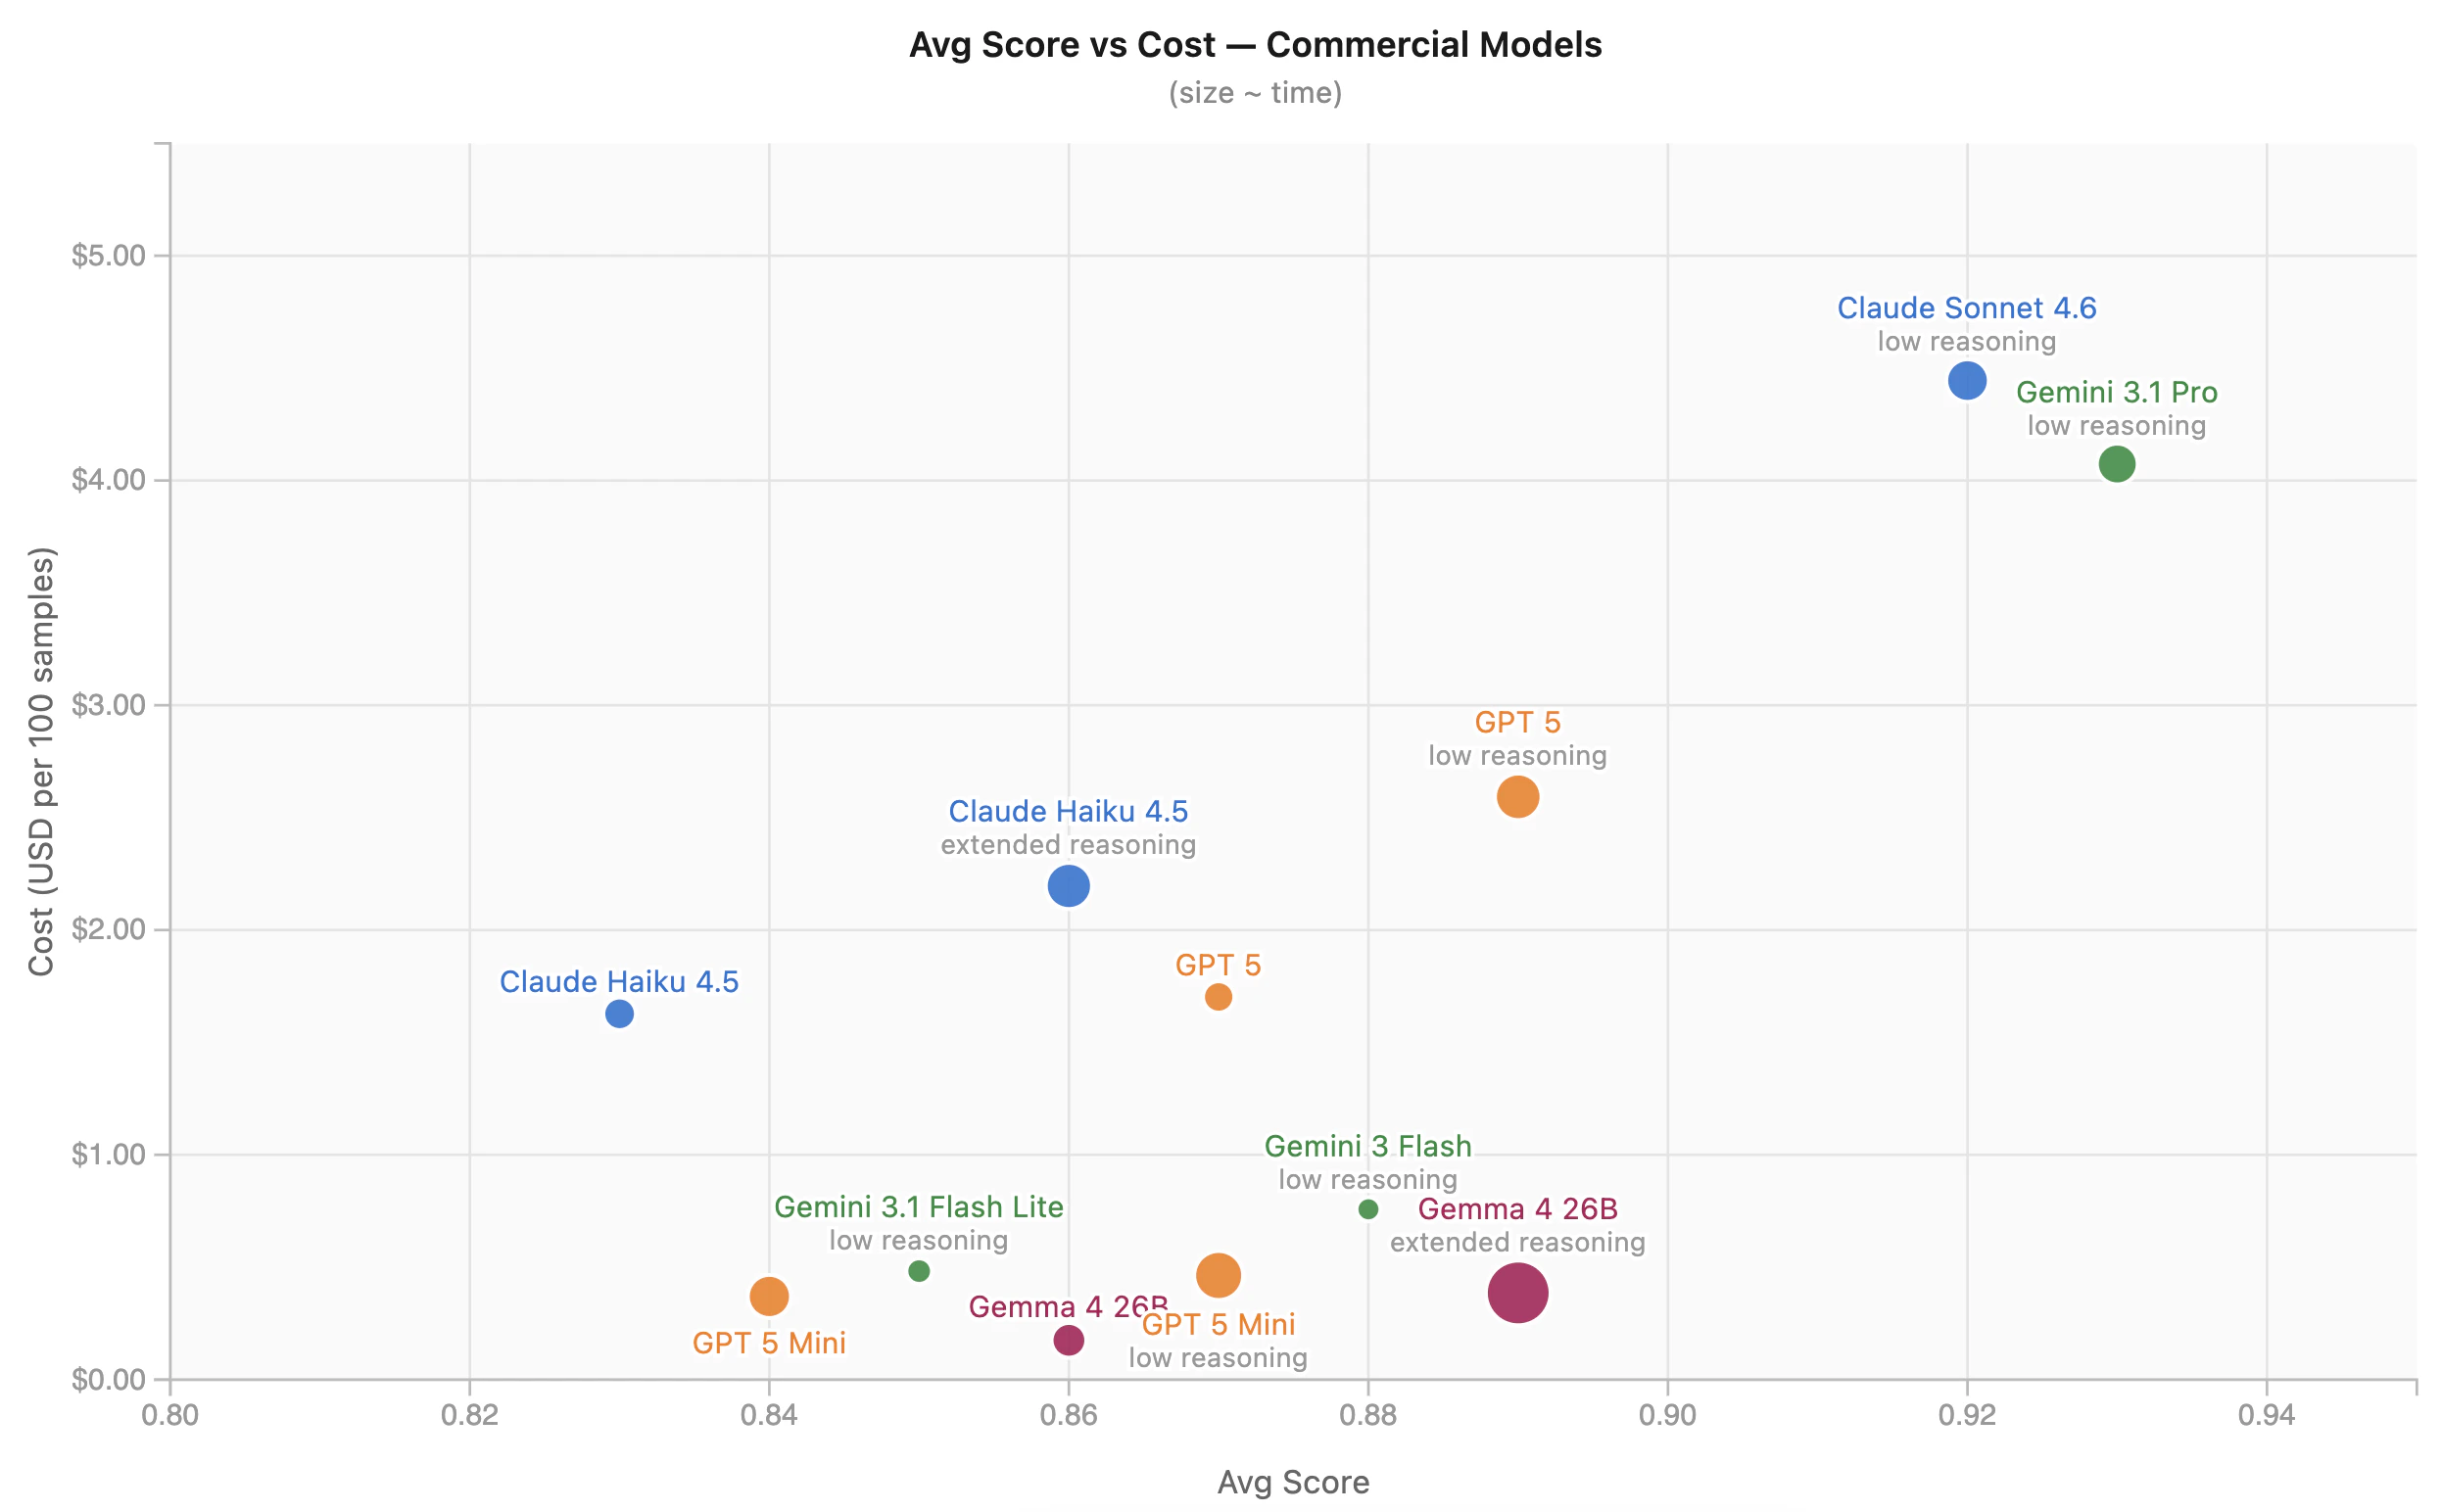
Les meilleures options en termes de rapport coût-performance
Gemini 3 Flash a produit le meilleur équilibre global dans nos résultats : score de 0,88, latence de 7 secondes, 0,76 $ pour 100 requêtes – plus de 5 fois moins cher et plus de deux fois plus rapide que Gemini 3.1 Pro. Le seul modèle plus rapide est GPT-5 nano sans raisonnement, qui obtient un score nettement inférieur de 0,58.
Gemma 4 sur Vertex AI est l'option viable la plus rentable, avec un coût total de 0,17 $, un score de 0,86 et une latence de 13 secondes. Il se situe juste en dessous de Gemini 3 Flash en termes de qualité, mais à moins d'un quart du coût. Pour les applications à fort volume, cette différence s'accumule rapidement.
GPT-5 mini avec un raisonnement faible mérite également d'être mentionné : 0,87 pour 0,46 $, égalant le score du modèle GPT-5 complet fonctionnant sans raisonnement (1,70 $) – même qualité, un quart du coût.
Gemma auto-hébergé égale l'API gérée
Nous faisons tourner Gemma 4 à la fois sur notre propre infrastructure et via Vertex AI. Les résultats sont pratiquement identiques dans les deux modes de raisonnement – 0,85 (auto-hébergé) contre 0,86 (Vertex AI) sans raisonnement, et 0,90 contre 0,89 avec raisonnement activé. Le nombre total de tokens de sortie sur 100 requêtes sans raisonnement est également très proche : 51 223 (auto-hébergé) contre 52 405 (Vertex AI). Pour les équipes qui déploient des modèles ouverts en production, ce type de vérification croisée est important : lorsque la sortie auto-hébergée s'aligne avec l'API gérée, tant en qualité qu'en verbosité, on peut avoir confiance dans le fait que le déploiement est correctement configuré et que les résultats du benchmark se transposent d'un environnement à l'autre.
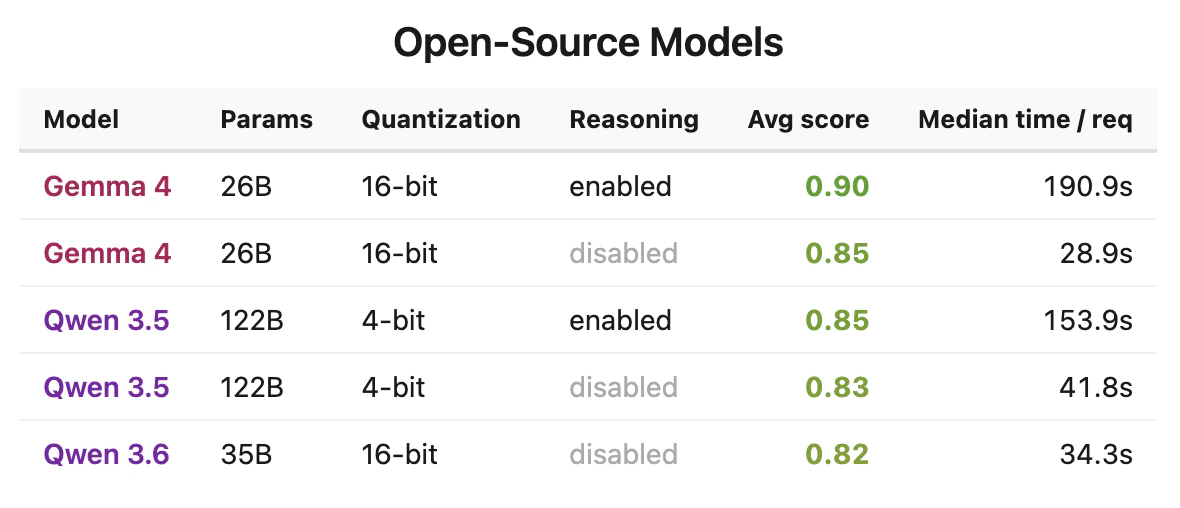
Le raisonnement aide, mais les gains sont modestes
Sur l'ensemble des modèles testés dans les deux modes, un raisonnement étendu ou faible ajoute généralement 0,02 à 0,03 au score :
- GPT-5 : 0,89 (faible) contre 0,87 (aucun)
- Claude Haiku 4.5 : 0,86 (étendu) contre 0,83 (aucun)
- Qwen3.5 122B : 0,85 (étendu) contre 0,83 (aucun)
Le fait que cette amélioration justifie ou non la latence et le coût dépend de votre situation. Pour une synthèse de sécurité – où la tâche consiste en une rédaction structurée à partir de preuves fournies plutôt qu'en un raisonnement multi-étapes – les gains sont réels mais pas transformateurs.
L'exception notable est GPT-5 nano : sans raisonnement, il obtient un score de 0,58, le plus bas de tout le benchmark, et c'est le seul modèle qui a régulièrement produit des synthèses incomplètes ou mal structurées. Avec un effort de raisonnement faible, il grimpe à 0,72. Pour les modèles plus petits dotés d'une capacité intrinsèque plus faible, le raisonnement peut porter une plus grande part du travail.
Points clés à retenir
Réaliser cette évaluation a changé notre façon d'aborder le choix des modèles pour des tâches de production dans la fourchette « complexe mais pas de niveau frontière » :
- Les classements généraux testent l'étendue, pas la profondeur. Le rang d'un modèle sur des benchmarks généraux ne prédit pas ses performances sur une tâche métier spécifique. La seule façon de le savoir est de l'évaluer sur votre charge de travail réelle avec vos données réelles.
- Le raisonnement est un compromis, pas une amélioration gratuite. Pour la plupart des modèles, il ajoute 0,02 à 0,03 au score au prix d'une latence significative. Le fait que cela en vaille la peine dépend de votre tâche – pour une rédaction structurée ancrée dans des preuves fournies, les gains sont réels mais modestes.
- Évaluez sur des données de production, pas sur des échantillons synthétiques. L'échantillonnage stratifié à partir de requêtes réelles a révélé toute l'étendue des types de tâches qu'un benchmark sur données synthétiques aurait manquée. Le modèle que vous choisissez peut se comporter très différemment sur la queue de votre distribution.
- L'auto-hébergement est viable si vous le validez. Les modèles open source fonctionnant sur votre propre infrastructure peuvent égaler la qualité d'une API gérée – mais seulement si vous le vérifiez. Le score, la longueur de sortie et le comportement de raisonnement doivent tous concorder avant de le déployer en production.
Si vous souhaitez voir le type de synthèses que ces modèles génèrent, Radar Lite est gratuit – il suffit d'entrer un domaine et de poser une question.
Annexe
Tableau des résultats
Résultats du benchmark des LLM
Modèle | Raisonnement | Score | Latence moyenne | Coût total |
Gemini 3.1 Pro | faible | 0,93 | 17 s | 4,07 $ |
Claude Sonnet 4.6 | faible | 0,92 | 19 s | 4,44 $ |
Gemma 4 26B (auto-hébergé) | activé | 0,90 | 250 s | auto-hébergé |
GPT-5 | faible | 0,89 | 38 s | 2,59 $ |
Gemma 4 26B (Vertex AI) | activé | 0,89 | 48 s | 0,39 $ |
Gemini 3 Flash | faible | 0,88 | 7 s | 0,76 $ |
GPT-5 | désactivé | 0,87 | 18 s | 1,70 $ |
GPT-5 mini | faible | 0,87 | 29 s | 0,46 $ |
Claude Haiku 4.5 | activé | 0,86 | 21 s | 2,20 $ |
Gemma 4 26B (Vertex AI) | désactivé | 0,86 | 13 s | 0,17 $ |
Gemini 3.1 Flash Lite | faible | 0,85 | 7 s | 0,48 $ |
Gemma 4 26B (auto-hébergé) | désactivé | 0,85 | 31 s | auto-hébergé |
Qwen3.5 122B | activé | 0,85 | 186 s | auto-hébergé |
GPT-5 mini | désactivé | 0,84 | 24 s | 0,37 $ |
Claude Haiku 4.5 | désactivé | 0,83 | 12 s | 1,63 $ |
Qwen3.5 122B | désactivé | 0,83 | 45 s | auto-hébergé |
Qwen3.6 35B | désactivé | 0,82 | 36 s | auto-hébergé |
GPT-5 nano | faible | 0,72 | 17 s | 0,56 $ |
GPT-5 nano | désactivé | 0,58 | 8 s | 0,24 $ |
Phong's work explores a number of projects focused on NLP, anomaly detection, active learning and visualisation. He is a most known for his work behind Red Sift Radar.